

Andrew Rosenthal, 25 March 2021, "**If increased consumption in Q39** What are the sources of increased consumption? Check all that apply. (Q39a S+W2020)", contributed by Andrew Rosenthal and Alison Kenner, The Energy Rights Project, Platform for Experimental Collaborative Ethnography, last modified 7 April 2021, accessed 26 July 2026. https://energyrights.info/content/if-increased-consumption-q39-what-are-sources-increased-consumption-check-all-apply-q39a-0
Critical Commentary
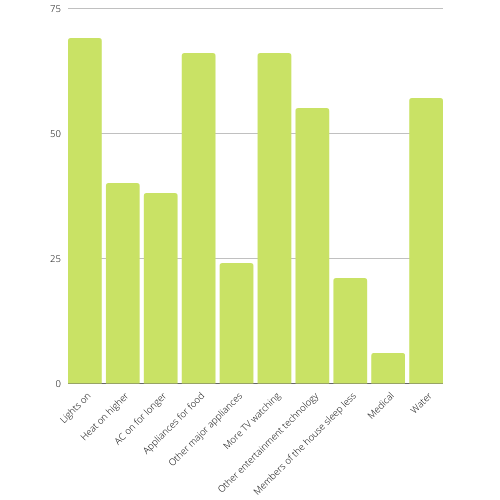
This chart reflects responses to Question #39a from the Spring 2020 and Winter 2020 surveys, which asks respondents who noticed increased consumption during COVID-19, “What are the sources of increased consumption?” The available options were “more lights are on”, “we are keeping the heat on a higher temperature”, “we are using air conditioning for longer periods of time”, “we are using more appliances to prepare food during the day”, “we are using more appliances to work/study from home”, “more TV watching”, “more video game playing”, “the use of other entertainment technologies”, “members of the household are sleeping less”, “medical devices are being used”, “we are using more water”, “we are using more electric-powered devices to work/study from home.
There were a total of 108 responses to this question. Sixty-nine respondents (63.9%) reported keeping more lights on during the day. Forty responses (37%) reported keeping the heat at a higher temperature. Thirty-eight respondents (35.9%) reported keeping the air conditioning on for longer periods of time. Sixty-six respondents (61.1%) used appliances to prepare food during the day. Twenty-four respondents (22.2%) reported using other major appliances more often. Sixty-six respondents (61.1%) reported watching more TV. Thirty-eight respondents (35.9%) reported more video game play. Fifty-five respondents reported to the use of other entertainment technology (50.9%). Twenty-one respondents (19.4%) reported members of the house are sleeping less. Six respondents (5.5%) reported using medical devices more often. Fifty-seven respondents (52.8%) reported using more water.
The data was produced by the Shifting Energy Demands in COVID-19 Survey, which has been administered to 169 people over two time periods. The Spring 2020 survey was administered to 86 people between May and June, and the Winter 2020 survey was administered to 83 people between December 2020 and March 2021. Visit the Shifting Energy Demands in COVID-19 - Spring + Winter 2020 Survey Results page to view more data from our survey. The project is approved by Drexel’s IRB.