
Andrew Rosenthal, "**If yes to Q45** What does this assistance look like? Explain. (Q45a Wi2020)", contributed by Andrew Rosenthal and Alison Kenner, The Energy Rights Project, Platform for Experimental Collaborative Ethnography, last modified 30 June 2021, accessed 6 July 2026. https://energyrights.info/content/if-yes-q45-what-does-assistance-look-explain-q45a-wi2020
Critical Commentary
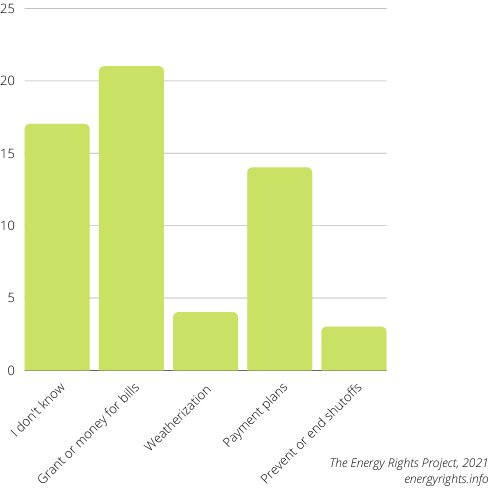
The chart reflects responses to Question #45a from the Winter 2020 survey, which asked, “If yes to Q45, “What does this assistance look like? Explain.” This was an open-ended question. There were fifty-four respondents who answered this question.
Seventeen respondents (31.5%) reported that they did not know.
Twenty-one respondents (38.9%) mentioned grants or money that reduces your bill amount.
Four respondents (7.4%) described weatherization of their house.
Fourteen respondents (25.9%) mentioned payment plans.
Three respondents (5.5%) mentioned programs to get your utilities back on.
The data was produced by the Shifting Energy Demands in COVID-19 Survey - Overview, which was administered to 83 people over a fourteen week period between December 2020 and March 2021. Visit the Winter 2020 Shifting Energy Demands in COVID-19 - Survey Results page to view more data from our survey. The project is approved by Drexel’s IRB.