
Andrew Rosenthal, 22 June 2021, "**If yes to Q45** What does this assistance look like? Explain. (Q45a Sp2020)", contributed by Andrew Rosenthal and Alison Kenner, The Energy Rights Project, Platform for Experimental Collaborative Ethnography, last modified 30 June 2021, accessed 27 July 2026. https://energyrights.info/content/if-yes-q45-what-does-assistance-look-explain-q45a-sp2020
Critical Commentary
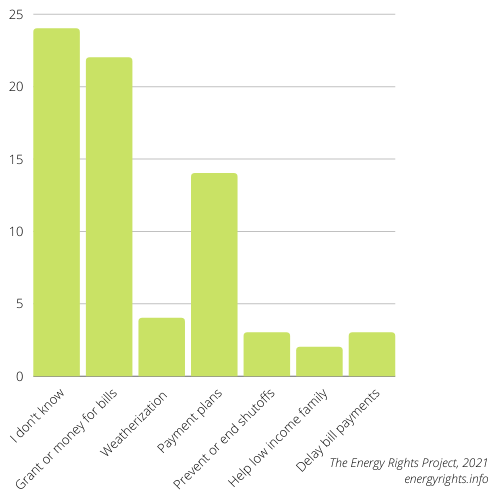
The chart reflects responses to Question #45a from the Spring 2020 survey, which asked: “If yes to Q45, “What does this assistance look like? Explain.” This was an open-ended question.
There were fifteen responses to this question.
One respondent mentioned the functions of two different programs.
Seven respondents (46.7%) said they did not know what this assistance looked like.
Two respondents (13.3%) said it helped low income families.
Three respondents (20%) mentioned allowances for delayed utility payment or moratoriums on bills.
One respondent (6.7%) mentioned grants and another (6.7%) mentioned weatherization.
The data was produced by the Shifting Energy Demands in COVID-19 Survey - Overview, which was administered to 86 people over a six week period in May-June 2020. Visit the Shifting Energy Demands in COVID-19 - Survey Results page to view more data from our survey. The project is approved by Drexel’s IRB.