

Daniel, J. (2019, July 10). 6 Maps That Show How Bad Energy Poverty Is and Reveal 2 Ways to Make it Better. Retrieved from https://blog.ucsusa.org/joseph-daniel/6-maps-that-show-how-bad-energy-po...
Joseph Daniel, "Single Family Homes v. Multi-Unit Home Energy Bill Maps", contributed by Morgan Sarao, The Energy Rights Project, Platform for Experimental Collaborative Ethnography, last modified 14 April 2020, accessed 28 July 2026. https://energyrights.info/content/single-family-homes-v-multi-unit-home-energy-bill-maps
Critical Commentary
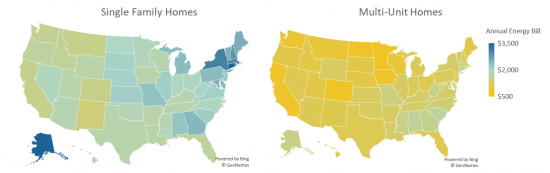
These maps show the cost of annual energy bills for single family homes (left) and multi-unit homes (right) that are below the poverty line.